🤖 AI Agents for Enterprise Support
AI Agents for Enterprise Support
Handle millions of calls with the memory, empathy, and zero wait time your customers expect. Built for enterprise complexity with seamless integrations and ultra-low latency.
99.9%
Uptime
100%
Win Rate
<1s
Response Time
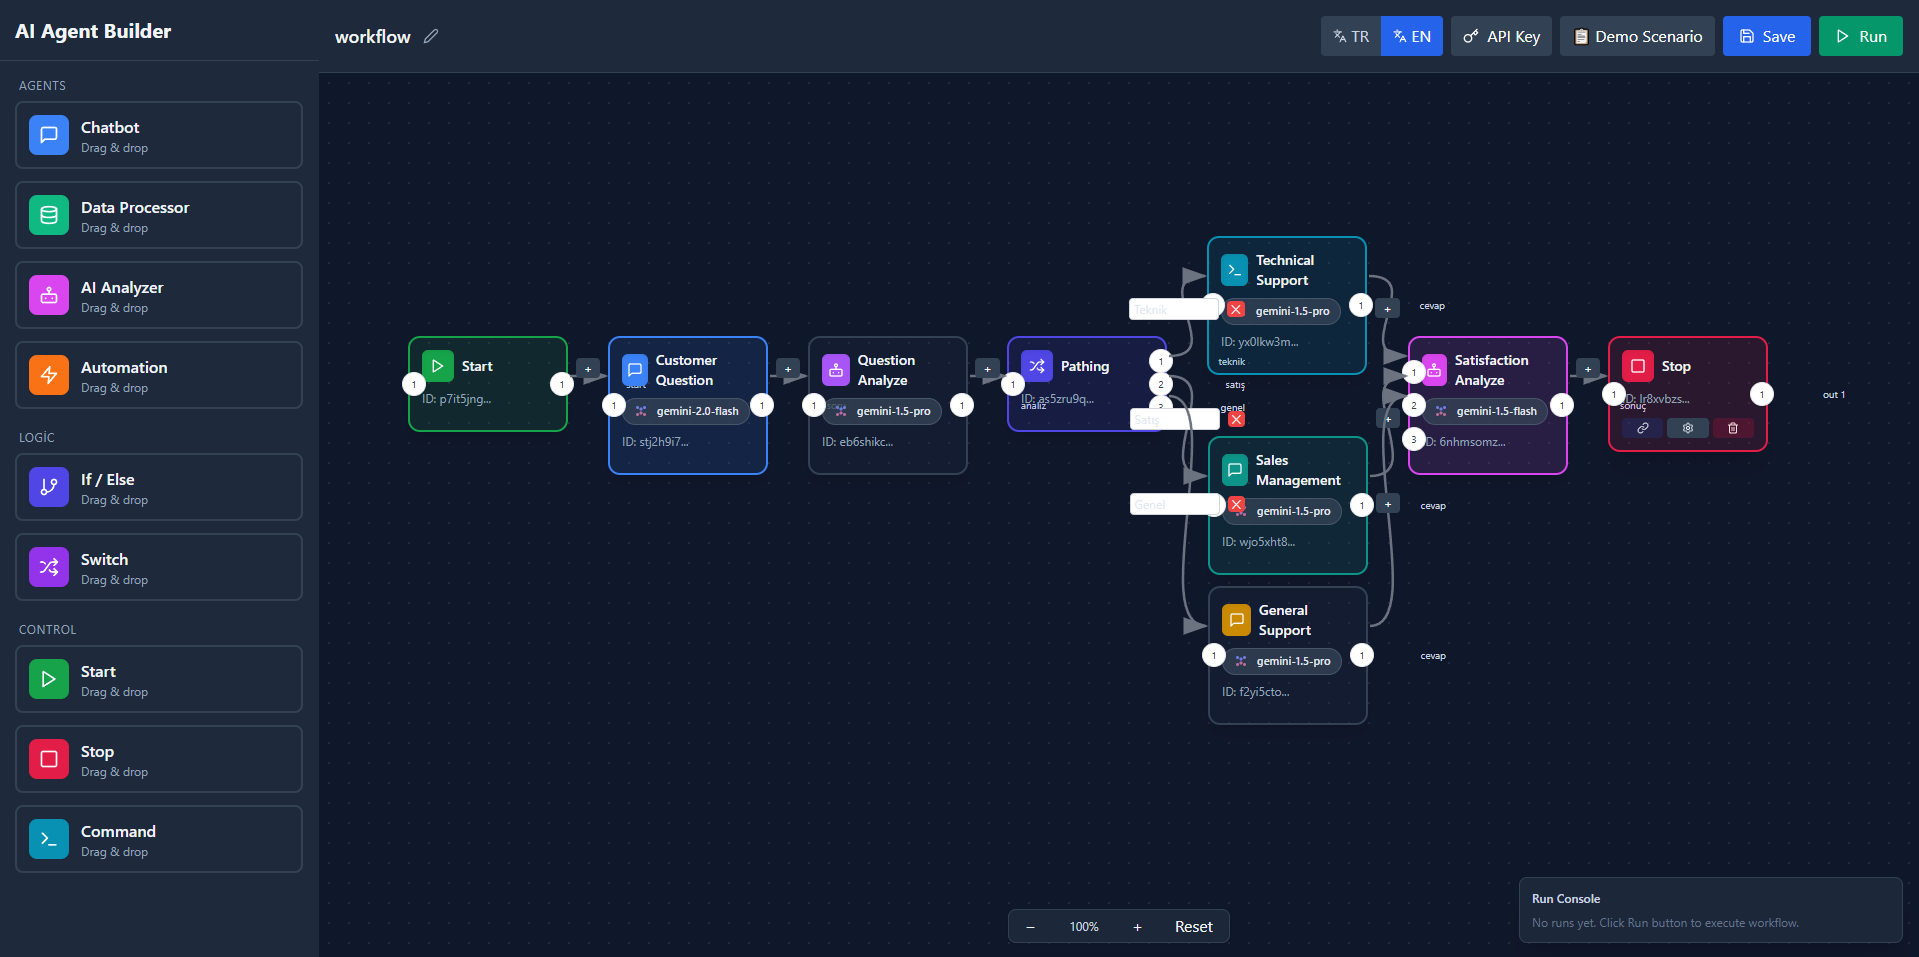
Visual Builder
No-code interface
Lightning Fast
Deploy in minutes
Easy Integration
100+ connectors
Scale Effortlessly
Enterprise-ready
🤖
💬
🎯
⚡